
With the Chancellor’s 2016 Autumn Statement formally burying the previous “austerity” target of achieving a budget surplus by 2020 and instead adopting a new, more expansionary fiscal rule, how does the recent era of fiscal austerity compare with major fiscal squeezes of the past? Christopher Hood and Rozana Himaz put the data into historical perspective and consider the implications for the future.
The Recent Fiscal Squeeze and the Longer Term Pattern
Since 2010, the UK has been subjected to one of the longest periods of public spending restraint over the last century. But according to our research that episode also seems to fit a long-term pattern of changes in the depth and composition of fiscal squeezes.
When we look back at the historical data summarised in Figure 1 below, we find the period since the mid-1980s has been one in which successive governments have opted for small, year-to-year reductions in the growth of overall public spending, rather than greater reductions over a shorter period.
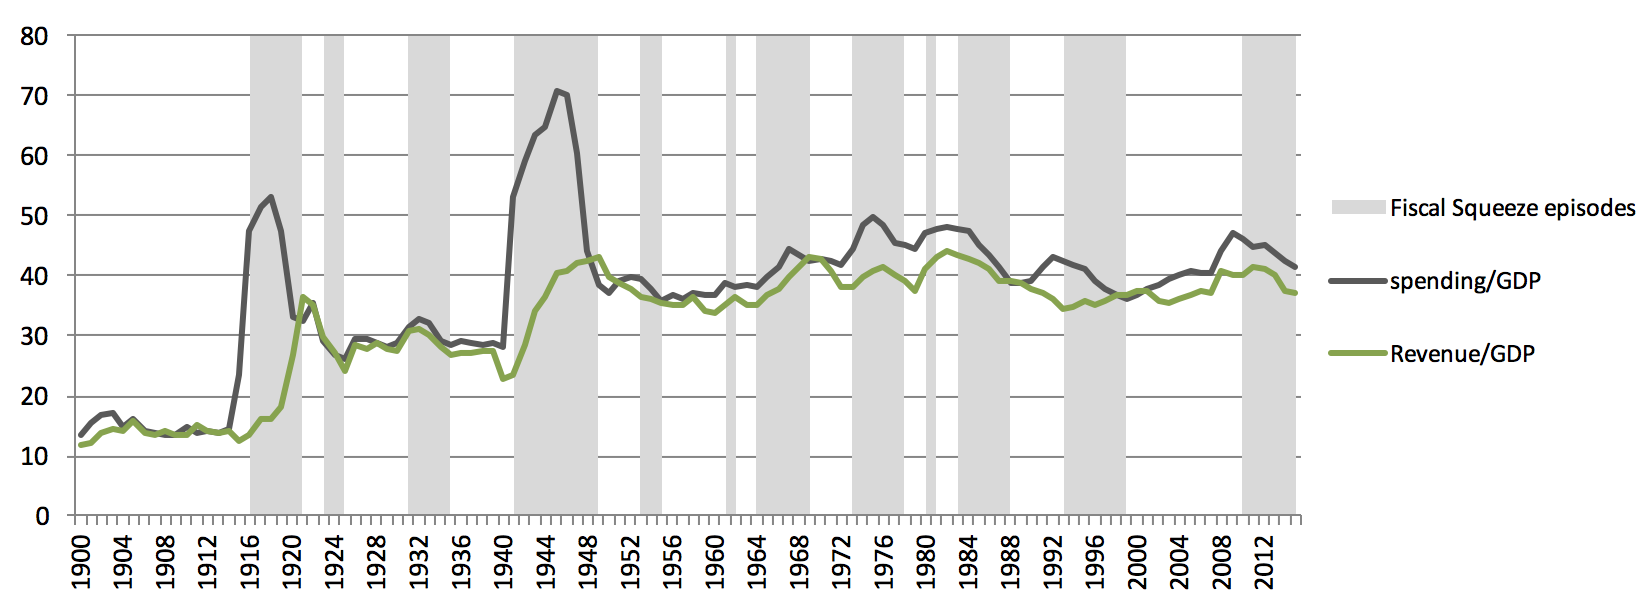
In those more recent fiscal squeezes, year-to-year cuts in public spending have been notably less deep than those imposed after both world wars or the “Geddes Axe” cuts initiated by the Conservative-Liberal coalition of the early 1920s. The last three squeezes on government spending have relied heavily on slowing the rate of growth of public spending rather than cutting spending in constant-price terms. This is despite the catch-all language of “cuts” used by political opponents, as well as by governments themselves when it suited to portray themselves as bearing down hard on public spending.
Based on reported financial outcomes, figure 2 shows the varying intensity of the 18 squeeze episodes since 1915. “Hard” fiscal squeezes (coloured grey) are defined as increases in tax revenue or falls in public spending both in absolute (constant price) terms and relative to GDP (above a defined threshold); “soft” squeezes (light yellow) are revenue rises or spending falls in only one of those ways.
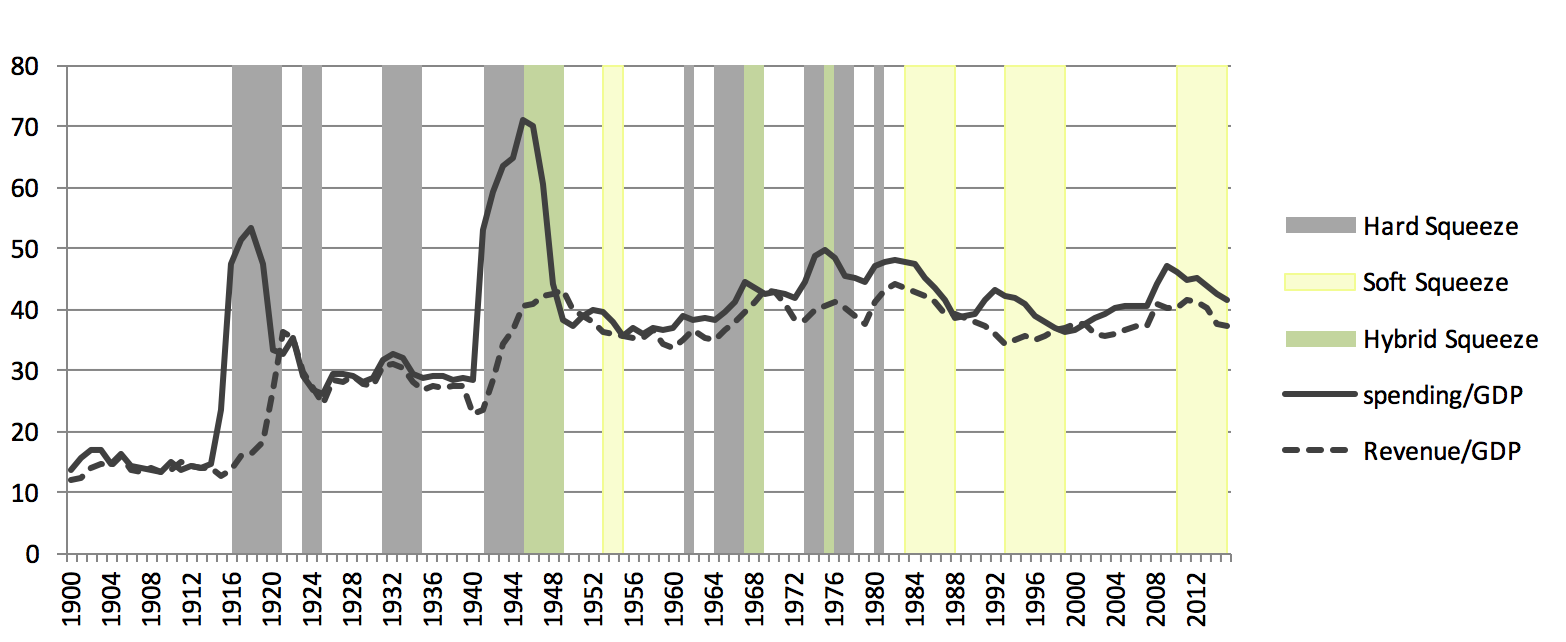
As can be seen from the graph, the 2010-15 squeeze resembles all the other episodes since the 1980s in being “soft” compared to the squeezes imposed earlier in the twentieth century. In our analysis, the rarest type of fiscal squeeze is “double hard” when governments reduce public spending and increase tax revenue both in real terms and as a proportion of GDP. Such an outcome is unusual both internationally and in the UK. It has only happened once in Britain in the last 100 years, just after World War I (between 1919 and 1921) when high wartime tax rates were retained along with massive post-war demobilisation.
Another long-term pattern in the historical evolution of fiscal squeezes is that an episode of hard revenue squeeze in order to fund extra public spending has not been experienced in the UK since the mid-1970s. And again the most recent fiscal squeeze seems to fit a trend in which increases in tax revenue have played a smaller part in fiscal austerity packages in the UK over the last 30 years than in earlier periods. Despite military operations such as in Afghanistan and Syria, there have been no special war taxes as was the case in the world wars; nor have there been increases in regular taxes that are specifically justified by the need to fund wars, although wars have sometimes featured as a reason for not reducing taxes (for example in the 1990s).
The more recent fiscal squeeze also fits a pattern in which numerous revenue increases have been concentrated on increases in taxes or charges outside the headline rates of income tax and the main indirect taxes such as VAT – a pattern dubbed as “stealth taxes” – or on sudden “windfall” revenue raids on politically unpopular groups or institutions, such as Labour’s windfall tax on the privatised utilities in 1997, and the Conservative-Liberal Democrats’ tax on bank balance sheets in 2010. And over that more recent period (again in contrast to earlier episodes) there were no other forms of austerity imposed alongside fiscal squeeze, in the form of general wage caps, exchange controls or tight money policies.
Independent of any economic rationale, there could be said to be a political and electoral logic in this move towards longer and softer squeezes. In our analysis of 100 years of fiscal squeezes in the UK, we found that hard revenue or spending squeezes were associated with a 77 to 86 per cent likelihood of the incumbent parties in government losing at the next general election, compared with the 38 to 42 per cent likelihood of losing the next election that was associated with soft revenue and spending squeezes.
A more qualitative analysis points to a similar conclusion. In contrast to the squeezes that seemed to involve the highest political effort or risk (including that of 1931-1933, which broke Ramsay MacDonald’s minority Labour government and led to a massive electoral landslide, and the 1977-1979 revenue and spending squeeze after the 1976 currency crisis), squeezes that involve holding the rate of spending growth below the rate of growth in GDP or avoiding increases in the most visible and mainstream taxes make it easier for incumbent parties to avoid outright breaches of election promises over spending and taxation. Indeed, the electoral punishment of the Liberal Democrats after breaking their 2010 election pledge to cut university tuition fees seems likely to reinforce the political incentives for small, year-to-year reductions.
The Future
If the hundred-year pattern shown in our graphs is any guide to the future, austerity and fiscal squeeze is likely to reappear in the UK before too long. Indeed, with debt to GDP rising – having reached nearly 90 per cent – further austerity looks like a distinct possibility for the next parliament.
If austerity does indeed come back and the next fiscal squeeze episode turns out to be like the last, following the trend shown in Figure 2 and the apparently greater electoral survival chances for incumbents associated with soft squeezes, it will be soft, spending-focused and long. And there might well be an economic argument for avoiding hard revenue squeezes in the context of Brexit.
But it is always risky to extrapolate from the recent past to the future. The next fiscal squeeze could be very different from those of the past few decades if it starts with a debt wall more comparable to that of the 1920s and 1930s, when governments’ room for fiscal manoeuvre was sharply limited by their predecessors’ decision to fund the huge costs of World War I largely by borrowing rather than by taxes. It could also be different if it coincides with importunate military pressures or pressures on the currency that preclude slower-paced adjustment (as in 1931 or 1950), or if it takes place in the context of an external bailout that cuts across the normal electoral cycle (as with the US bailout of the Attlee government in 1949, the IMF bailout of 1976 or the more recent Eurozone bailouts), or in a context of no or very low economic growth over a prolonged period. In any of those circumstances (or a combination) it will be the more distant past rather than more recent events that the next fiscal squeeze could resemble.
____
Note: the authors were co-editors (with David Heald) of the book, When the Party’s Over: The Politics of Fiscal Squeeze in Perspective (British Academy/Oxford University Press, 2014). Christopher Hood and Rozana Himaz’s forthcoming book, A Century of Fiscal Squeeze Politics, will be published by Oxford University Press in the summer of 2017.
This article was first published by the LSE British Politics and Policy Blog.
Comments

