In this post, Visiting Professor Christopher Hood and Research Officer Ruth Dixon consider why we should care about government administration costs, and call for greater transparency in the reporting of such costs. This article picks up on themes explored in their book, A Government that Worked Better and Cost Less? (OUP, 2015) which recently won the Political Studies Association’s 2016 W.J.M. Mackenzie Book Prize.
High Stakes, Big Claims
Every UK government at least since that of Margaret Thatcher over three decades ago has made much of its efforts to bear down on the costs of running government. Why? Just as those who give to charity want to see as much as possible of their money go to the intended beneficiaries rather than chief executives’ salaries, and investors in companies want to see overhead and administration costs kept down, elected politicians want to show voters that they are running a tight ship. Especially in times of austerity, they want to demonstrate that as much as possible of the taxpayers’ hard-earned cash goes directly on ‘programme’ activity (such as health care, teaching, policing) and as little as possible on ‘administration costs.’ That is what political scientists call a ‘competency’ or ‘valence’ issue, meaning that political parties have an incentive to prove their ability to contain such costs irrespective of their different policy positions on other issues. The Conservative-Liberal Democrat coalition of 2010-15 announced particularly dramatic ambitions to cut government administration costs by a third in five years (and indeed to cut the cost of politics as well). So what can we say about what the outcome of such efforts?
Broadly the picture seems to be that over the past thirty years, the results of efforts to rein in administration costs in UK central government were at best modest as long as governments stuck to a fairly consistent definition of what counted as administration costs. But over the past decade or so more impressive-seeming results have gone along with radical and non-transparent redefinitions of who or what counts as ‘administration,’ so that it has become effectively impossible to distinguish the effect of moving the goalposts from the quality of management. And what lies behind those redefinitions is the fact that, despite the beguiling analogies with overhead costs in charities or business firms, the point at which ‘administration costs’ begin and ‘programme costs’ end in government is fundamentally ambiguous. Should ‘administration costs’ be equated (as they used to be) with the costs of employing civil servants and running government offices as distinct from the money paid out in grants, government contracts or welfare benefits? Or should we try to decide who within the public service is to be counted as an ‘administrator’ (whatever that term means) and who is not? The first approach is undoubtedly crude, while the second unavoidably involves deeply contestable angels-on-the-head-of-pin judgements. For example, if we had to fit the monarchy into this accounting dichotomy, should we count the Queen as an ‘administrator,’ a ‘service deliverer,’ both, or neither?
Low Transparency
Administration or ‘running costs’ as they were then called, were introduced in the 1980s to give government departments more flexibility in determining staffing levels and to make them responsible for the costs of services previously provided centrally. The definitions remained fairly stable until in 2004 an efficiency review conducted by Sir Peter Gershon led to the reclassification of a large number of civil servants (mainly prisons, courts, and immigration staff) out of administration costs. Since then, it has not been clear how many staff are included in administration costs, and neither has the total civil service pay bill been officially reported since that date.
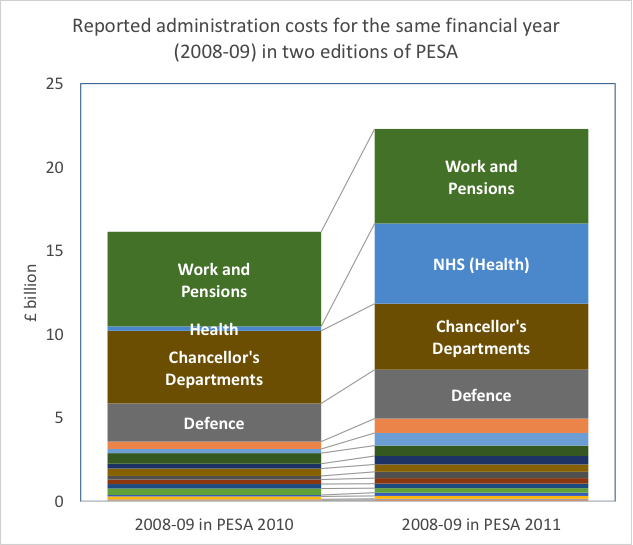
In 2011, administration costs underwent another major redefinition. For the first time, non-departmental public bodies (NDPBs or ‘quangos’) were brought into administration costs. Figure 1 shows that the effect of that change was to increase the costs reported for the financial year 2008-09 from £16 billion (as reported in Public Expenditure Statistical Analyses(PESA) 2010 under the old definitions) to £22 billion (in PESA 2011). These changes meant that, for the first time, staff who were not civil servants were included in administration costs.

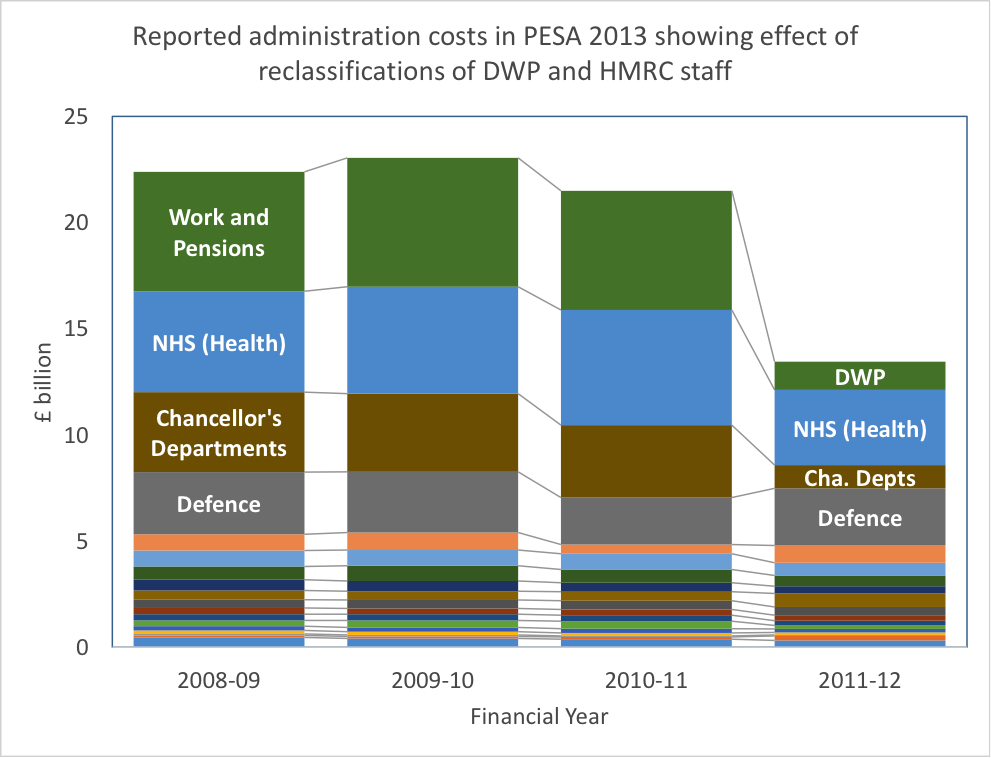
The next major change came in the costs reported for the 2011-12 financial year, when another large (but unknown) number of staff were classified out of administration, mostly from the Department for Work and Pensions (DWP), and HM Revenue and Customs (HMRC). But the overall effect of those reclassifications can’t be assessed, because, for the first time, PESA no longer showed the effect of such reclassifications by showing the costs calculated in both the old and new ways (a ‘stepped overlapping series’ which allows reclassifications to be assessed transparently). Instead, the reclassifications were superimposed on any actual spending changes, which means that it was no longer possible to disentangle reclassifications from actual spending changes.
The effects of those two sets of changes – inclusion of NDPBs and exclusion of HMRC and DWP staff – were numerically large, but in opposite directions. Once the second reclassification had occurred, the total cost of administration in 2012-13 (as reported in PESA 2013) dropped back to about £13 billion, somewhat lower than that reported in 2010. However by 2013 the components of ‘administration’ were very different to what they had been in 2010. Figure 2 shows the reported administration costs from 2008-09 to 2011-12 reported in PESA 2013. These figures are all classed as ‘National Statistics’[1] even though their definition and components vary from year to year.

More recently, reported administration costs have steadily decreased. Perhaps administration costs have settled down to a new definition (albeit one known only to the compilers of PESA). On that generous assumption, the Coalition government achieved a reduction in net administration costs of 27 per cent in real terms between 2011-12 and 2014-15, which is much better than we observed over comparable periods in the three decades covered by our earlier analysis. The decreases, however, are dominated by the departments most affected by reclassifications and it is very difficult, perhaps impossible, to tell where the administration costs were cut. Big savings came from abolishing NDPBs with substantial administration costs such as Regional Development Agencies, and Department of Health bodies abolished under the Health and Social Care Act 2012. Departments whose administrative spending occurred mainly in the central Whitehall departments, and were correspondingly less affected by reclassifications, showed rather smaller proportional changes (11 per cent reduction on average, compared to 32 per cent among the four departments with the largest administration costs). The Treasury reported a 3 per cent increase in real-terms administration costs over the same period (though with considerable year-to-year variation).
We can compare this performance with Conservative aims to cut the cost of politics (as opposed to government) by reducing the numbers of members of both Houses of Parliament, and the Coalition’s promise to ‘cut the perks and bureaucracy associated with Parliament’ (Coalition Agreement, 2010, p.27). In fact we saw an increase in the number of Lords, no reduction in the number of MPs and, while it is not clear what ‘perks and bureaucracy’ the coalition intended to reduce, MPs’ office and staffing allowances increased substantially ahead of inflation. MPs’ salaries fell slightly in real terms until 2014, followed by a 9 per cent (real-terms) increase. Some progress was made, however, on another Coalition pledge to reduce the generous terms of MPs’ pensions. Overall, these changes were said to be revenue-neutral (that is, neither raising nor lowering overall costs to the taxpayer) by the Independent Parliamentary Standards Authority, the body created in 2009 to oversee and regulate such costs.
We are not the only observers to have noted the inconsistencies in administration cost reporting, but few raised any serious concerns. In its analysis of administration cost savings caused by the Public Bodies Reform programme, the National Audit Office (NAO) decided to exclude bodies associated with the Department of Health (the department subject to the largest administration cost changes), saying ‘the major reorganisation and transfer of functions between NHS bodies since 2010 made the analysis too problematic’ (NAO 2014, p.40). For public bodies included in the analysis, the NAO noted that the Cabinet Office used unpublished data and methodology that the NAO could not replicate (although the NAO said that the figures that it calculated by other means were roughly comparable). In its otherwise comprehensive Whitehall Monitor 2015 report, the Institute for Government (IfG) simply noted that, for administration costs, ‘[w]e are unable to compare 2014/15 with 2009/10 or 2010/11 owing to changes in government accounting’ (IfG 2015, p.51).
All in it Together?
As we noted above, it is no longer possible to reliably track the staffing costs of the traditional ‘administrators’ – the civil service. We can get some indication from a recent NAO report (Central government staff costs, 2015) which used unpublished Cabinet Office data to calculate that the total annualised salary cost for the civil service in 2014 was £11.13 billion, a decrease of £2.49 billion in real terms on 2010.The NAO attributed this fall mainly to an 18 per cent reduction in civil service staff numbers.
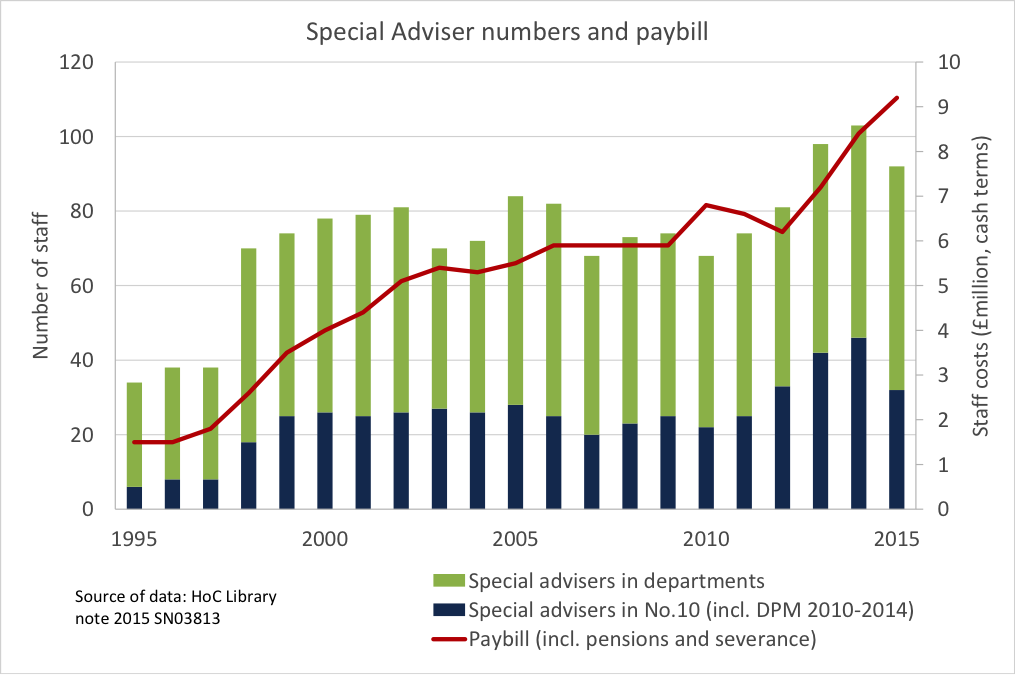
The brunt of the cuts fell on lower civil service grades, with some losing over 30 per cent of staff (more than 60,000 posts were lost among administrative officers and assistants) while staff in top grades (Grade 7 and above) showed a small net increase. Most civil service grades saw a real-terms decrease in median pay. The one category of civil servants which increased substantially in number and paybill over the past five years was ‘special advisers,’ the political appointees who work closely with ministers (Figure 3).

Can We Find a Better Trade-off Between Consistency and Timeliness in Government Running Costs?
The journey from a relatively consistent but undeniably crude way of measuring government running costs to one that is arguably more sophisticated but plastic and non-transparent has led into a morass. Incumbent politicians who want to claim ‘bragging rights’ for their achievements in bearing down on administration costs cannot be contradicted but also cannot gain independent verification of those claims because of the lack of transparency associated with the data changes. At the same time, as we have seen, there are few signs of running costs as traditionally measured falling at the very top of government. Parliamentarians, think-tanks, and scholars have no means of working out what has happened to government administration costs over more than very short periods of time. And the Office of National Statistics counts runs of administration costs numbers as ‘national statistics’ when those numbers plainly do not form a time series in any meaningful sense.
What is needed is more transparency and more attention to this important component of government expenditure – admittedly only a few per cent of total government spending but highly salient in public management and ‘austerity politics’ more generally. Parliamentary committees (particularly the Public Accounts Committee) and the public audit offices should be pressing for stepped overlapping series (that is, the numbers worked out in the old way and the new way) to be provided every time the definition and categorization of administration costs changes. That is normal statistical good practice. It does not prevent governments from altering what they choose to count as administration costs to suit the concerns of the day. But at the same time it makes longer-term assessment of performance possible – enabling just the sort of independent evidence-based policy for public management that governments constantly say they want.
[1] ‘National Statistics’ are a subset of official statistics which have been ‘certified by the UK Statistics Authority as compliant with its Code of Practice for Official Statistics.’ https://www.statisticsauthority.gov.uk/national-statistician/types-of-official-statistics/
This article was first published on the blog of the Blavatnik School of Government.


