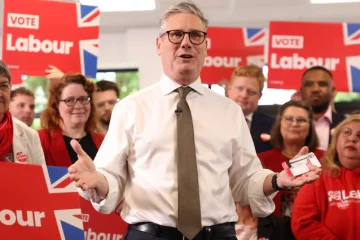
Labour Poll Surge Thanks To Not Just Younger, But Also Older Women
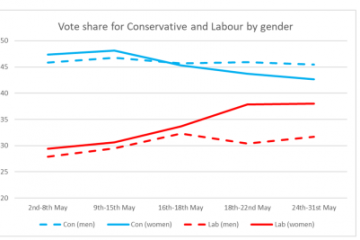
Coverage of recent polls has suggested that women are becoming more supportive of Labour and that this is driving the recent tightening of the election race. The figure below shows the average vote intention separately for men and women on average using data from a range of different pollsters (see methodological note below). At the beginning of May there was very little gender gap. The Conservative lead was much the same for men as for women. For polls conducted in the past week, on average the Conservatives still had a large, 14-point lead amongst men, but only a small, 4-point lead amongst women. Compared with the start of May, women are now 7 points more likely to vote Labour than …
The UK General Election 2017: What’s been happening in the polls?
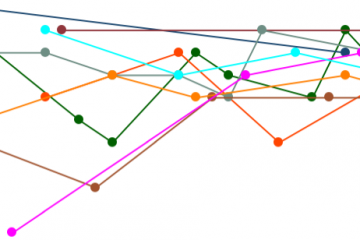
Since the general election was called Labour have gone up in the GB vote intention polls while the Liberal Democrats and especially UKIP have dropped. The Conservatives have fluctuated but on average remained steady. The following graph shows the overall trends. Looking at those pollsters that have published at least two polls since 18th April, the picture is pretty consistent for Labour, the Liberal Democrats and UKIP. As following three graphs of GB polls by fieldwork end date show, the trends are pretty much the same for nearly all pollsters. The more complicated picture is for the Conservatives. They went up on average at the beginning of the campaign, but, as the graph below shows, this was true for some …
Another Labour Meltdown?
The polls in Scotland just before the last election showed a 21-point lead for SNP over Labour. The SNP went on to take all but one of Labour’s 41 Scottish seats. This week Theresa May called a general election in the wake of polls showing her Conservative party 21 points ahead of Labour. Could Labour now be headed for a Britain wide meltdown of the kind that they suffered in Scotland two years ago? Intriguingly, the distribution of the 2015 Labour share of the vote across the seats they are defending now is very similar to the distribution of their 2010 share of the vote in the Scottish seats that they were defending in 2015. In both sets the vast …

What to make of the US Election Forecasts
The majority of forecasts point to Hilary Clinton winning tomorrow’s US presidential election. Several of the poll, market and expert forecasts with probabilities for who will win are helpfully summarised by the New York Times here. The polls-based predictions are all, apart from one, pretty confident that Clinton will win. At the time of writing, Drew Linzer’s model at Daily Kos puts the probability of a Clinton win at 87%, HuffPost has 98% and Sam Wang at the Princeton Election Consortium estimate is as high as 99%. The New York Times’ own model is slightly less confident, on 84%. The exception is Nate Silver’s FiveThirtyEight model which puts Clinton’s chances at just 67%. The lower probability for Clinton in the FiveThirtyEight model …

Why did the UK vote to leave the European Union?
It is not hard to see why Leave won. Evidence from numerous opinion polls showed that there was a clear majority for Leave on the basis of concerns about immigration and beliefs that leaving would reduce immigration. Moreover the same opinion polls showed us that there was no compensating majority who believed that the UK would be worse off if we left. Still less did people feel that they personally would be financially worse off. For further details see here. Although it should not have come as a surprise that Leave won, the result was close enough that it could easily have gone the other way. There will be much debate as to whether the Remain side could have made their …

How the BBC will be benchmarking the Results on EU Referendum Night
Referendum night is going to represent something of a departure from usual. There will not be the drama of an exit poll announcement to stir excitement – and possibly shock – at 10pm. Meanwhile, when the actual results do start to be announced, except in Northern Ireland they will not be declared by the parliamentary constituencies with which we have all become familiar. Rather they will be unveiled local authority by local authority. As a result, we will get just one declaration for the whole of Birmingham, while, at the other end of the spectrum, the Isles of Scilly will get their moment in the sun. But perhaps the biggest departure from the routine of election night will be that …

Forecasting the 2015 British general election: three weeks out
Forecasters, academic experts, journalists, pollsters and the betting markets have long been forecasting a seriously hung parliament with both major parties not only short of the 326 seats required for an overall majority but even forecast to get less than 300 seats. Meanwhile, an SNP landslide is expected in Scotland which would be hugely damaging for Labour and have major implications for the government formation process. If the forecasters and betting markets are right in their central forecasts then Con+LD+DUP combined will be short of a majority and so a Labour led government should form if they can secure the support of the SNP and probably others, including the Liberal Democrats, will be needed too: a potentially messy and unstable situation but also one where there is sufficient similarity in ideological perspective for policy agreement on plenty of issues.
But there is uncertainty associated with all the forecasts and some forecasters are trying to estimate the extent of that uncertainty, which in turn can be used to calculate probabilities of particular events (hung parliament, largest party, etc.)
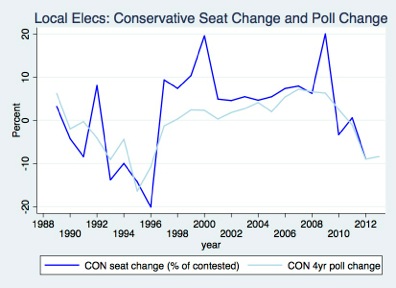
What do the polls tell us about local election results?
While some ask what local election results tell us about the state of the parties and prospects for the next general election, it is also important to consider how national party popularity affects the fortunes of candidates in local government elections. Local elections are often said to be about local issues but actually most of the changes over time in shares of council seats won the Conservatives, Labour and Liberal Democrats can be accounted for by changes the popularity of these parties at the national level.


