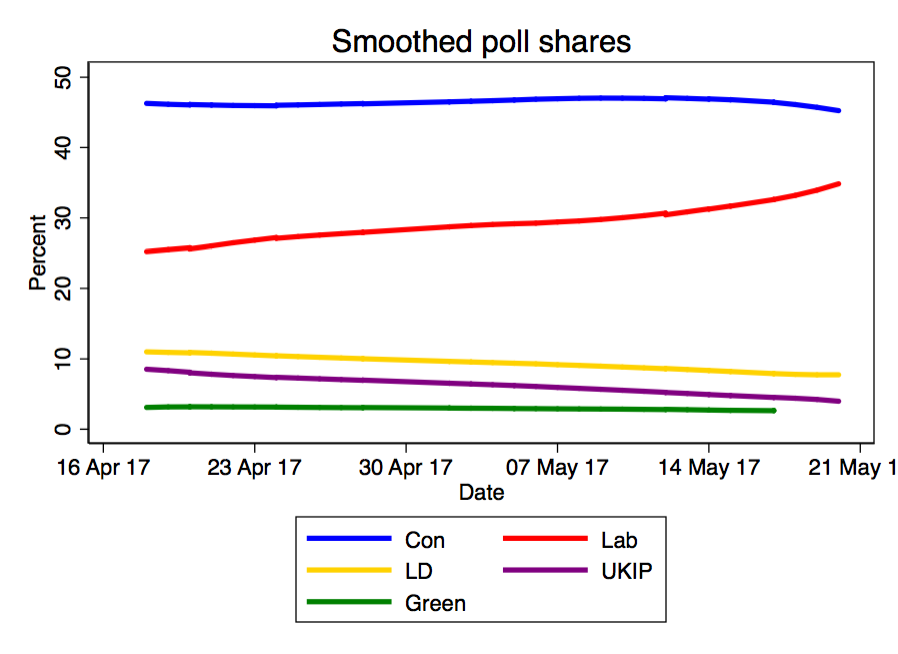
Since the general election was called Labour have gone up in the GB vote intention polls while the Liberal Democrats and especially UKIP have dropped. The Conservatives have fluctuated but on average remained steady. The following graph shows the overall trends.
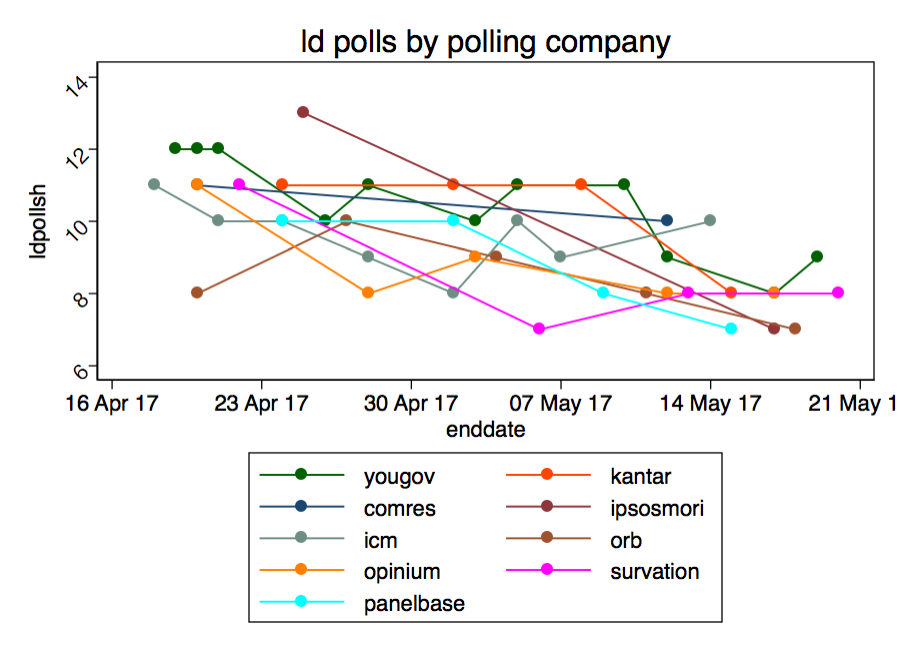
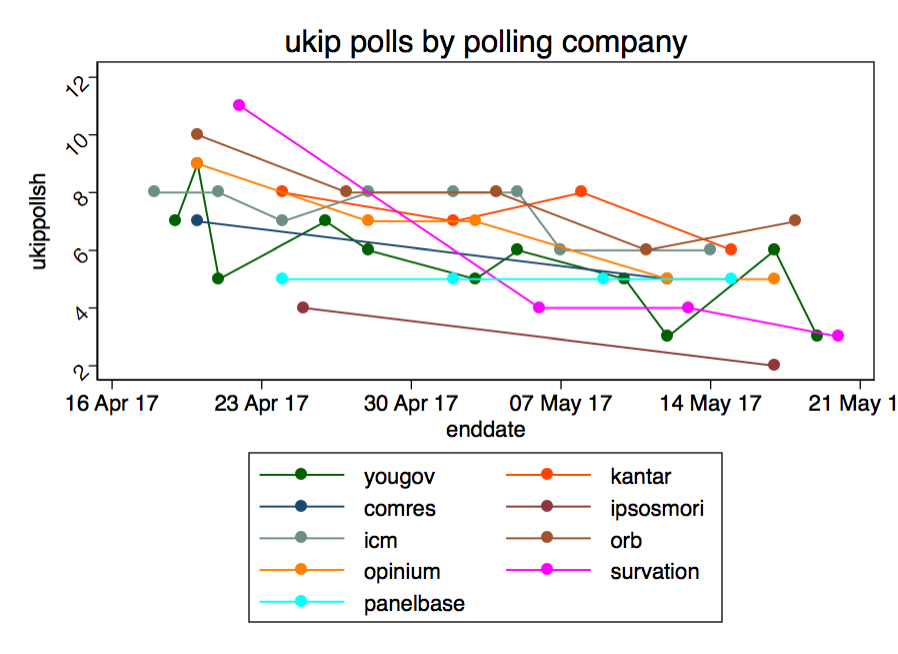
Looking at those pollsters that have published at least two polls since 18th April, the picture is pretty consistent for Labour, the Liberal Democrats and UKIP. As following three graphs of GB polls by fieldwork end date show, the trends are pretty much the same for nearly all pollsters.
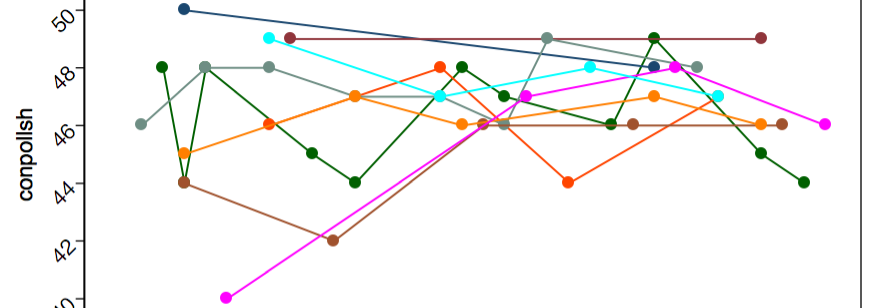
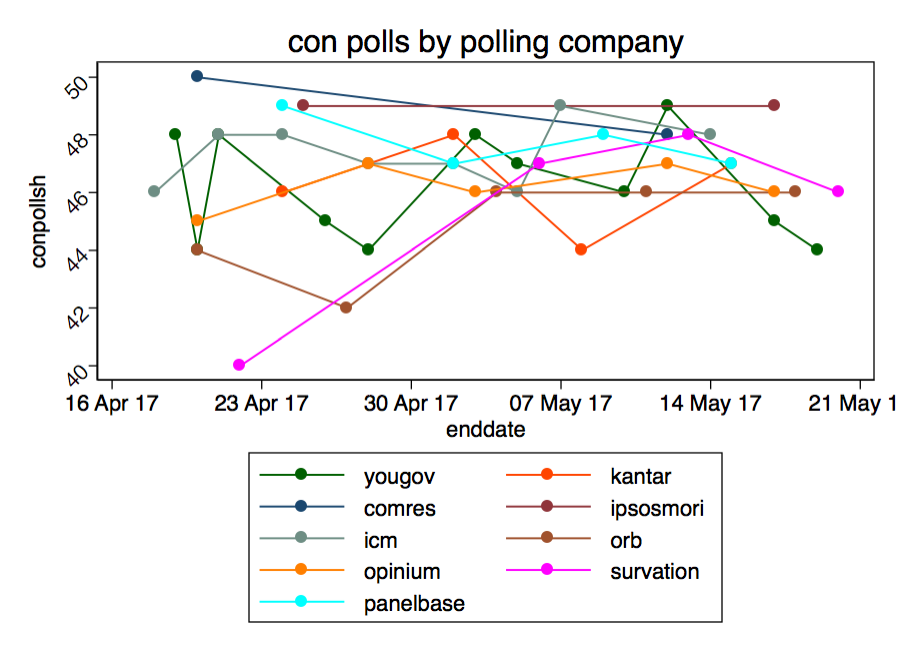
The more complicated picture is for the Conservatives. They went up on average at the beginning of the campaign, but, as the graph below shows, this was true for some but not all pollsters. Since the start of May there seem to have been somewhat trendless fluctuations for all the pollsters with no consistent trends. There is only a small suggestion that the Tories peaked at the end of last week only to come back down slightly this week.
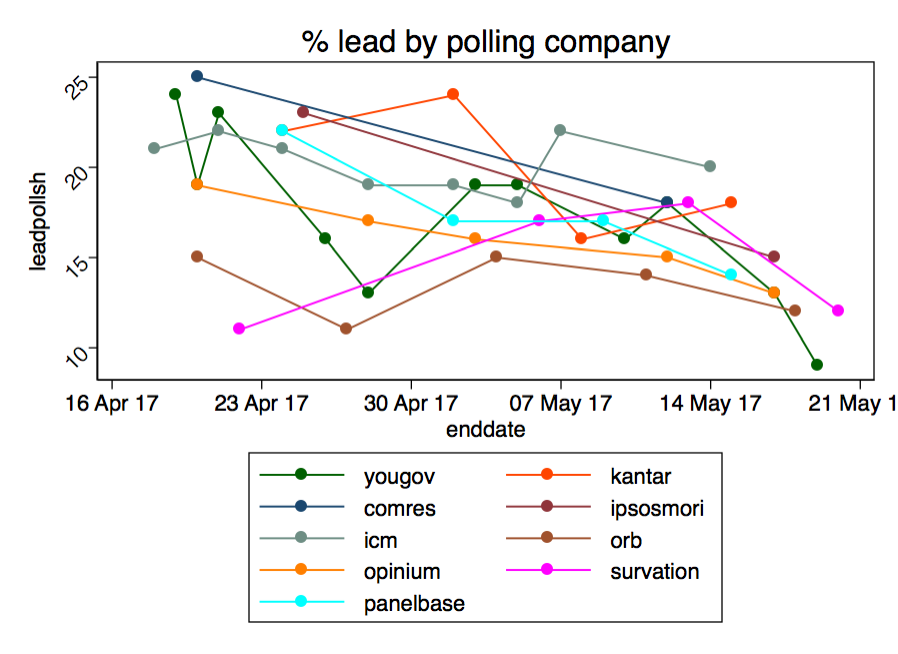
The net effect of the Conservative and Labour changes is a decline in the Tory lead for most but not all pollsters, as shown in the following graph. Viewed this way, the smaller than usual leads in tonight’s polls do not so much constitute a “wobble” as a continuation of a trend.
The average lead across the most recent poll from each pollster within the last two weeks is now 15 points. This is just short of the 16 point lead that is probably needed for a 100+ Conservative majority. Also, Labour are now polling on average slightly above their 2015 GB vote share.
These observations might be thought to provide some concern to Mrs May and comfort to Mr Corbyn. But the average of the final polls in 2015 had Labour a couple of points higher than Labour are now, and the eventual Conservative lead in 2015 was 7 points bigger than it was in the final polls.
A similar discrepancy between the polls and the actual result is not guaranteed to happen again, but it might.
This article was first published on the Elections Etc. website.

