
The 2016 United States presidential election—or in John Oliver’s most recent definition: ‘lice-on-a-rat-on-a-horse-corpse-on-fire-2016’—has reached its final leg. As a political scientist and a computational text analyst, I cannot resist sharing my two cents on an election that has certainly broken a model or two.
Following in the footsteps of two colleagues who recently produced two excellent articles (you can read them here and here), in this post I’d like to analyse a few examples of the exceptional language used in this elections cycle. Text analysis can help us understand two commonly held beliefs or facts (the distinction has become a bit blurred over the course of this year’s election cycle) about the US elections:
- Donald Trump is running a negative campaign based on fear, whereas Hillary Clinton sells a positive message of hope (i.e. “make America great again” because “it is losing bigly”—or rather, “big league” if I’m to believe what the linguists have to say on this—versus Clinton’s message of “stronger together”);
- As Politico’s Jack Shafer put it, Donald Trump speaks like a third grader, but his campaign manager Kellyanne Conway has managed to knock some sense—and perhaps political sophistication—into him since she was appointed in August 2016.
Can we “prove”—or rather “show”—these two basic statements with some simple text analysis tools?
There is reason to believe we can. (And also some reason to believe that we can’t; more on that later).
Campaign Speeches
We can look at a wide selection of campaign speeches by Clinton and Trump since their nominations at their respective conventions, including their convention speeches (for the Republican: Cleveland, Ohio, July 18-21; for the Democrat: Philadelphia, July 25-28, 2016). Transcripts of Hillary Clinton’s speeches are available here.
The “speeches section” on Mr Trump’s website only contains paraphrased summaries of the candidate’s speeches and videos, not the full transcripts themselves. The press releases section of “The Donald’s” website contains “remarks as prepared for delivery”. I decided to be generous and assume that these somewhat resemble what Trump actually said at his campaign rallies.
[As an aside, make sure to check out the “crooked Hillary question of the day” posts in the press releases section on Trump’s website; they’re hilarious. Other gems include: “Donald J. Trump’s history of empowering women”, “Hillary Clinton’s lips are moving… she must be lying”, and “Rudy Giuliani’s statement on Donald J. Trump’s debate victory”.]
So, the dataset consists of 25 speeches by Clinton, and 27 by Trump.
Now, one of the key assumptions of all (more accurately: most) text analysis models is the bag-of-words assumption. Simply put, this means that we can chop up sentences into individual terms, throw them into a virtual bag without them losing their meaning. We can take independent draws from this “bag”. In other words: any draw from the collection does not affect the probability of what word will be drawn next. (This is also known as the “naïve Bayes” assumption). This is an obviously wrong, but nevertheless useful, assumption of how text is generated.
The bag-of-words assumption bears an uncanny resemblance to the way Donald Trump’s speech writers go about their work. In fact, I’m pretty sure a Poisson process (with word and document parameters) comes pretty close to how Trump’s speeches are written, or at least, delivered.
The assumption outlined above means that when applying any text analysis model, we chop up our texts into words (or sometimes, into bi- or tri-grams) and, subsequently, run our analysis. All the codes for what follows below can be found on my GitHub page.
1. Does Trump run a more negative campaign than Clinton?
First up: does Trump really have a more negative campaign than Clinton? To investigate this, I use an unsupervised sentiment analysis algorithm.
Admittedly this is not the best approach. A better one would be to manually classify a subset of speeches (or in this case, individual paragraphs) as negative or positive, fit a model to this data, and subsequently apply the “trained” model to other data. This is the basic logic behind classifiers such as Naïve Bayes and Stochastic Gradient Descent—the same kinds of models used for spam filters on your computer. Such an approach gives the researcher more context-specific training data, and therefore more accurate results.
But in the interest of speed I will use the unsupervised variant.
I use a lexicon-based sentiment classifier, implemented using the Sentlex library in Python. And here it gets a bit wonky. Every word conveys “negative”, “neutral” or “positive” sentiment. This sentiment is on a continuous scale, and is based on the SentiWordNet 3.0 dictionary. This dictionary contains lemma-part of speech (PoS) pairs that share the same meaning called “synsets”. Each synset has a numerical score for the three categories (pos., neg., neutr.) on the interval [0.0, 1.0]. The sentiment scores are generated by a combination of a semi-supervised learning step, and a random-walk stage.
There are reasons to expect that the sentiment analysis will not perform too well, as one of the two candidates defies some of the assumptions that we might reasonably make about human speech and word usage. For example, Trump seems pretty keen to use the words “great”, “big”, “huge”, “incredible” and other hyperbole not only to describe his hands, but his “policies” too. As these words usually have a positive connotation we might actually see Trump come out as more positive than Clinton.
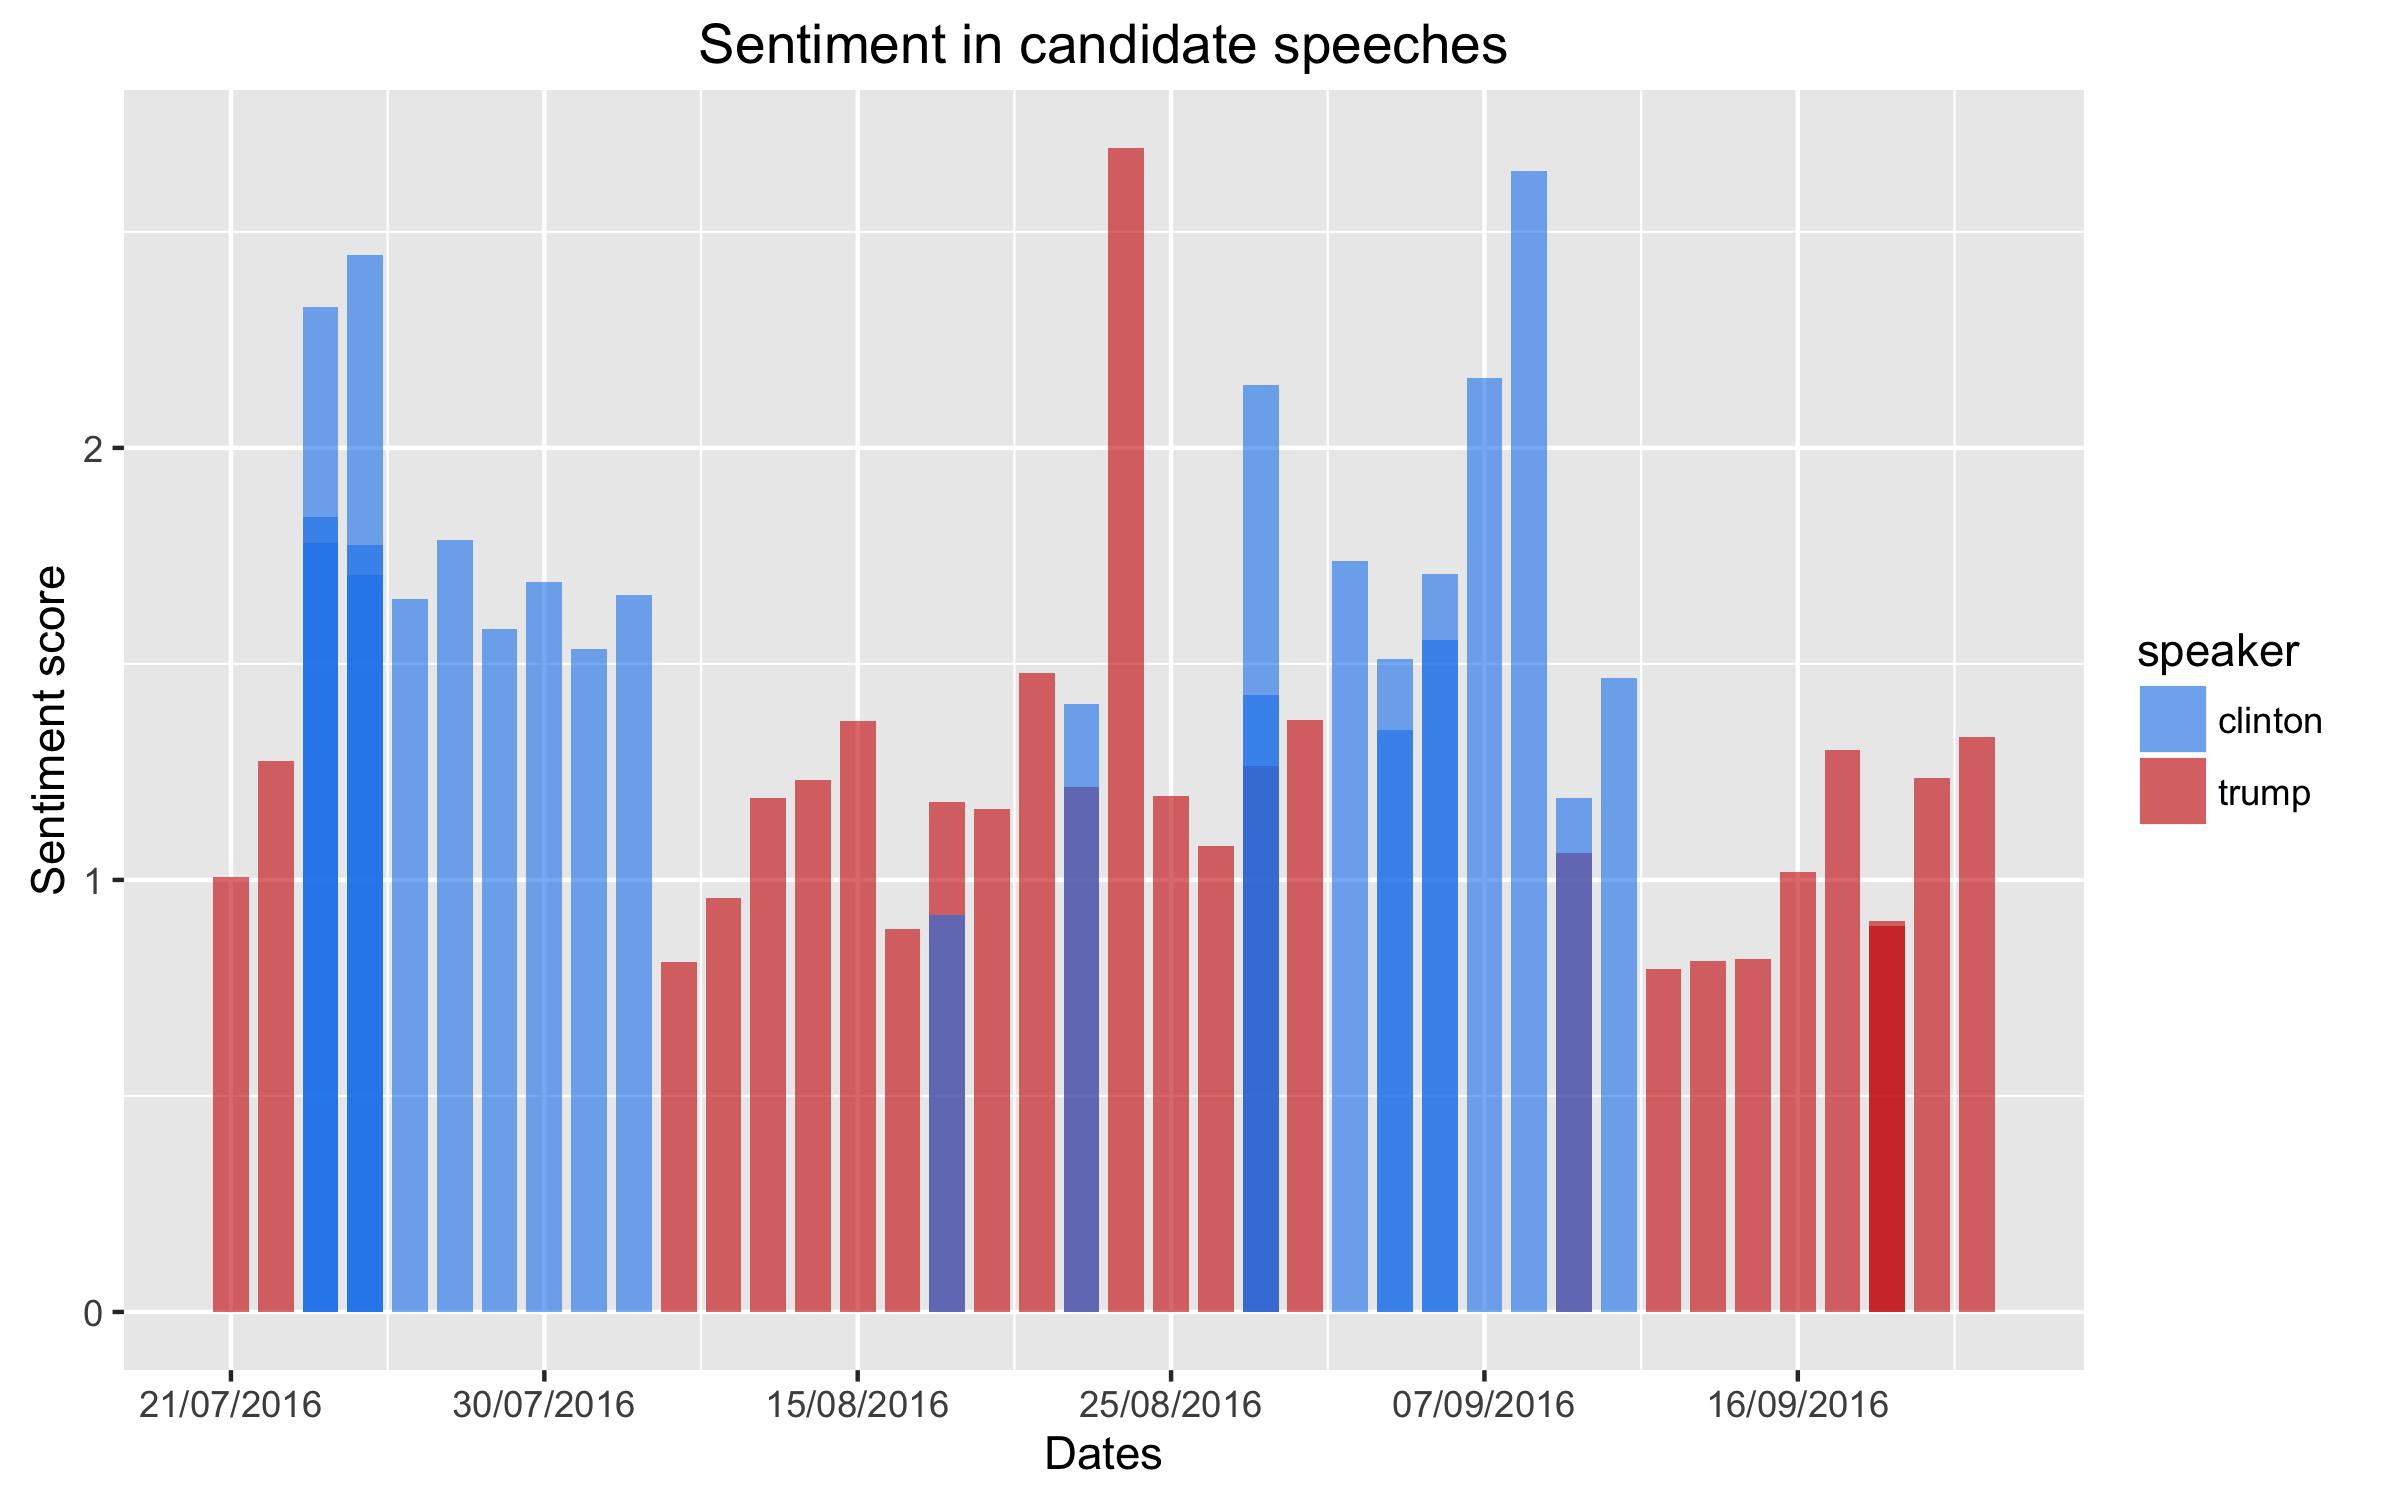
Fortunately, the model seems to perform well, and is in line with what we would expect. The graphs below show the ratio between the total positive and negative scores of the entire speech, as figure 1 below shows. It is clear that Trump is consistently more negative in his speeches than Clinton.
2. Does Trump actually talk like a third-grader?
Now on to the second question: does Trump have less-than-Shakespearean linguistic ability?
Here, the analysis is more straightforward. Fortunately, the education literature gives us a range of off-the-shelf tools to measure linguistic complexity. And, Ken Benoit’s “Quanteda” package for R offers a bunch of mathematical solutions to implement these measures, as well as a range of other text analysis tools that are incredibly useful (it even includes a score based on scrabble!). I use the Flesch-Kincaid reading ease score (based on sentence length), and the Dale-Chall index (based on both sentence length and the percentage of difficult words used). The results for Clinton and Trump speeches are shown in figures 2 and 3 below.
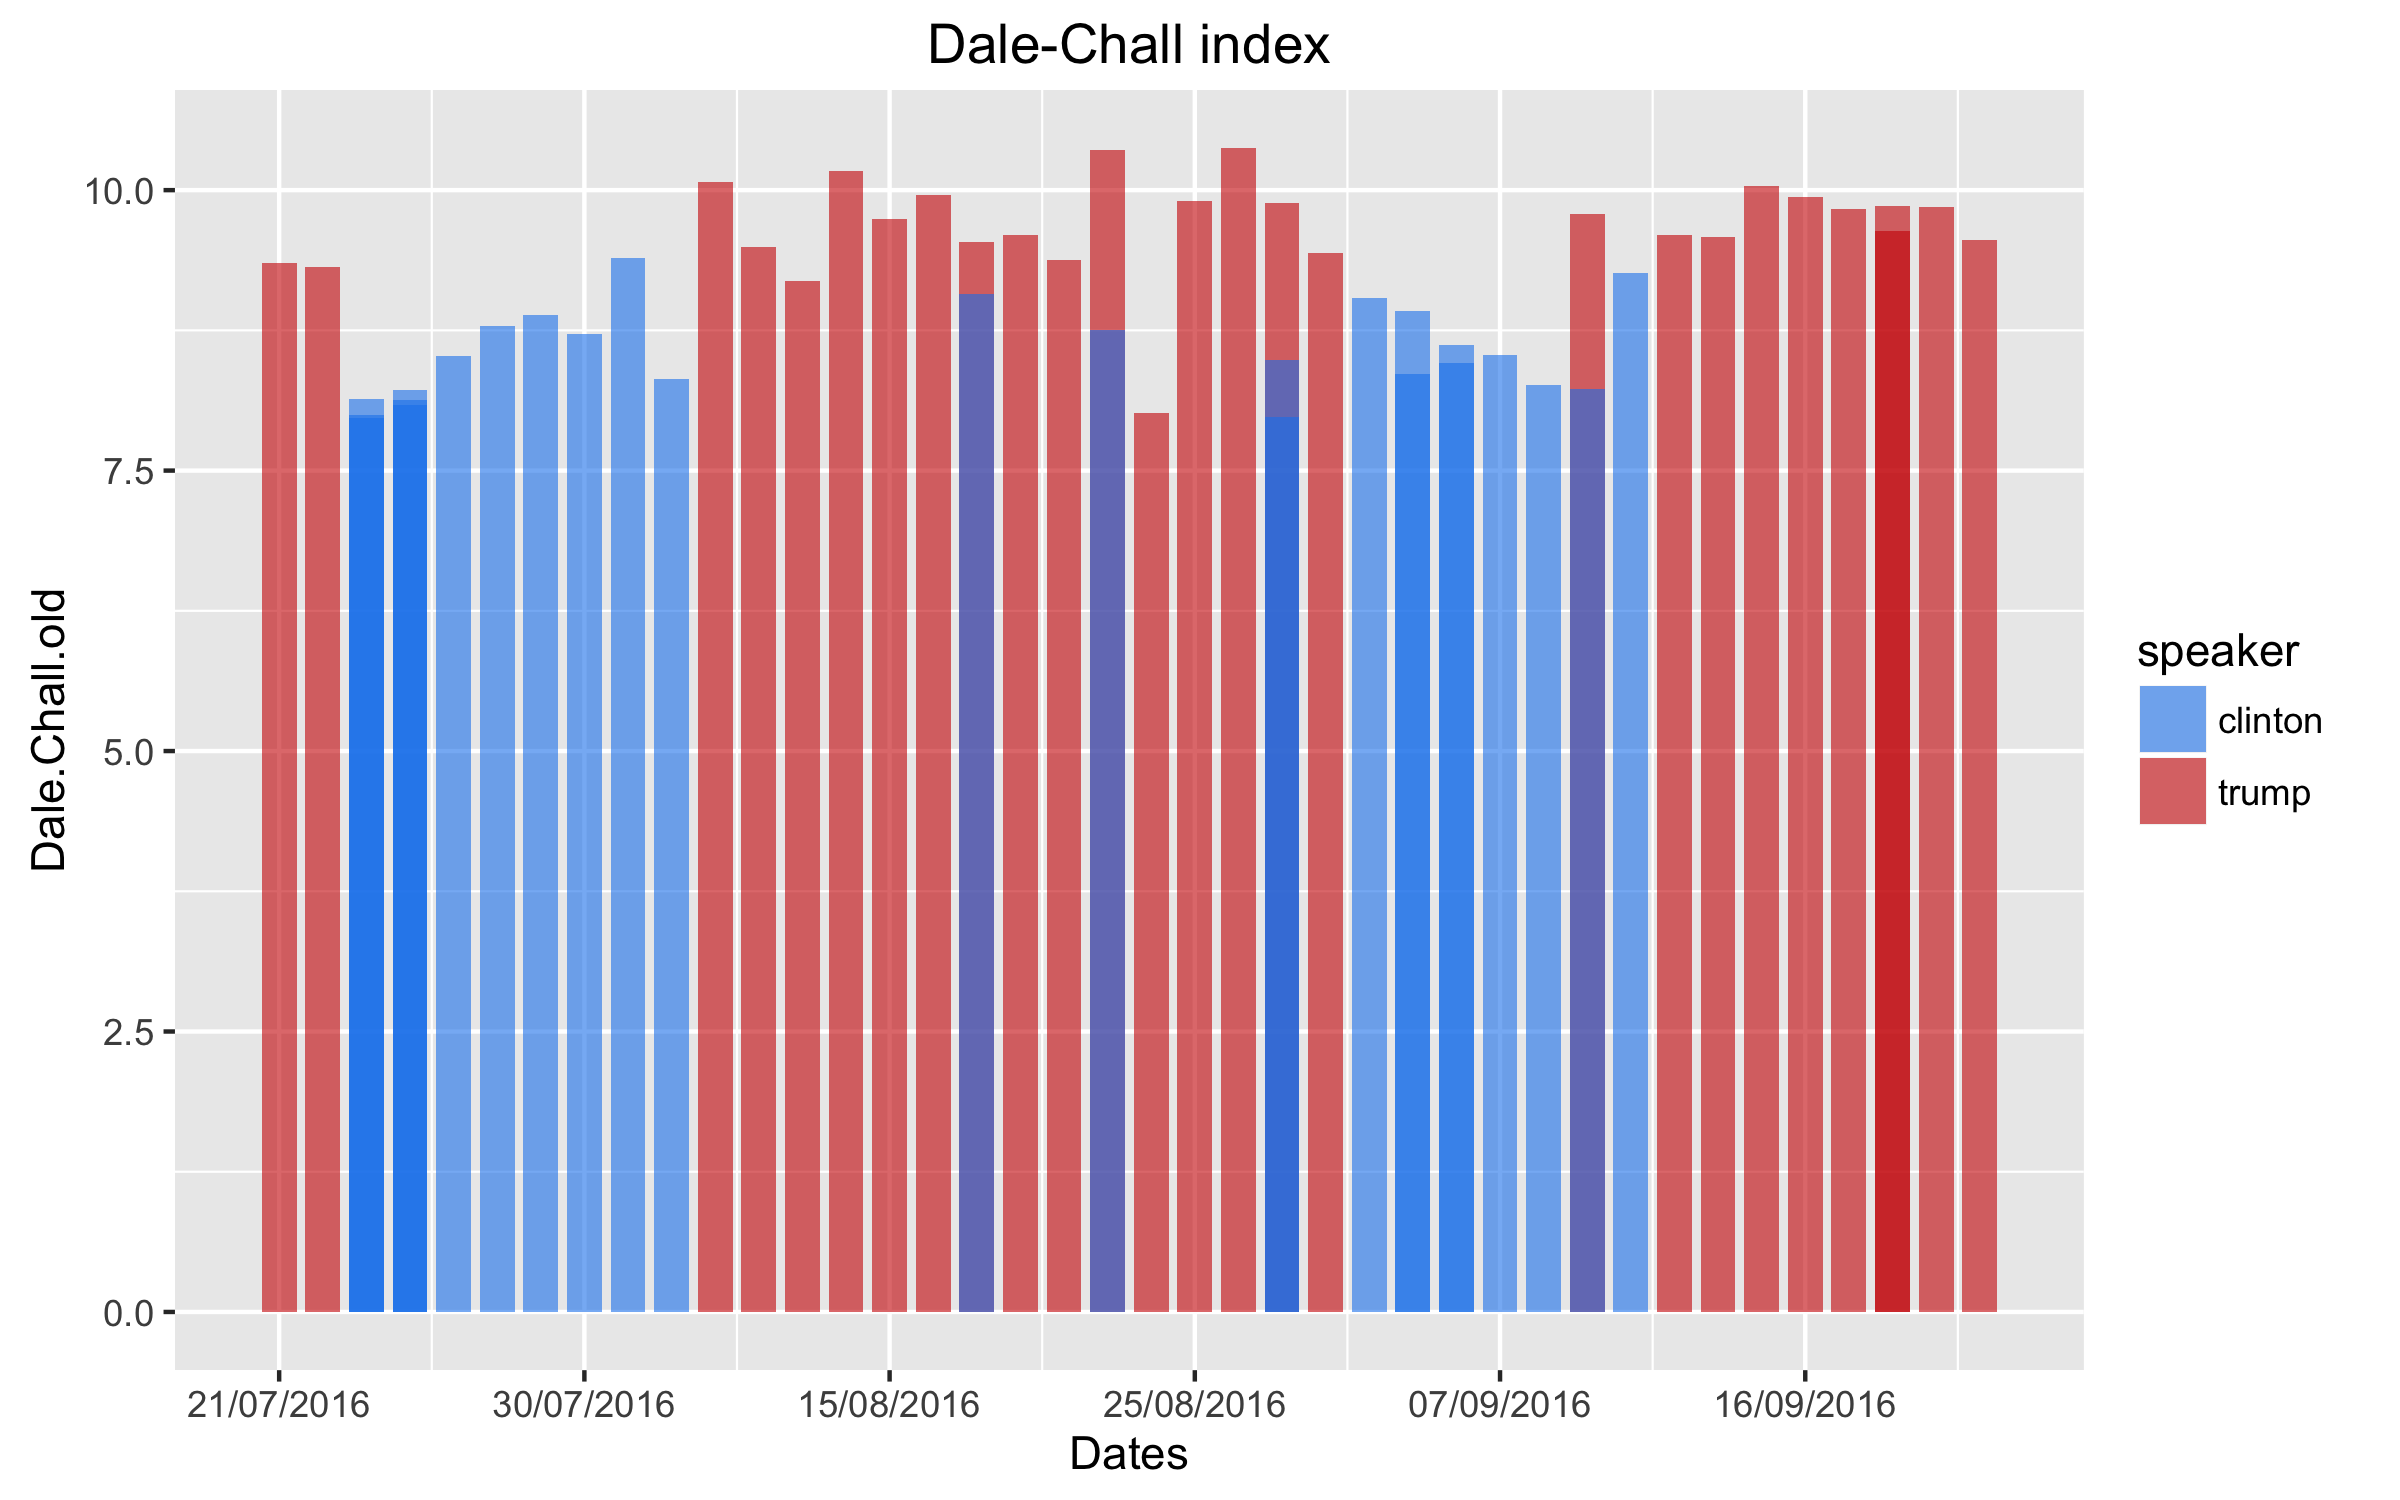
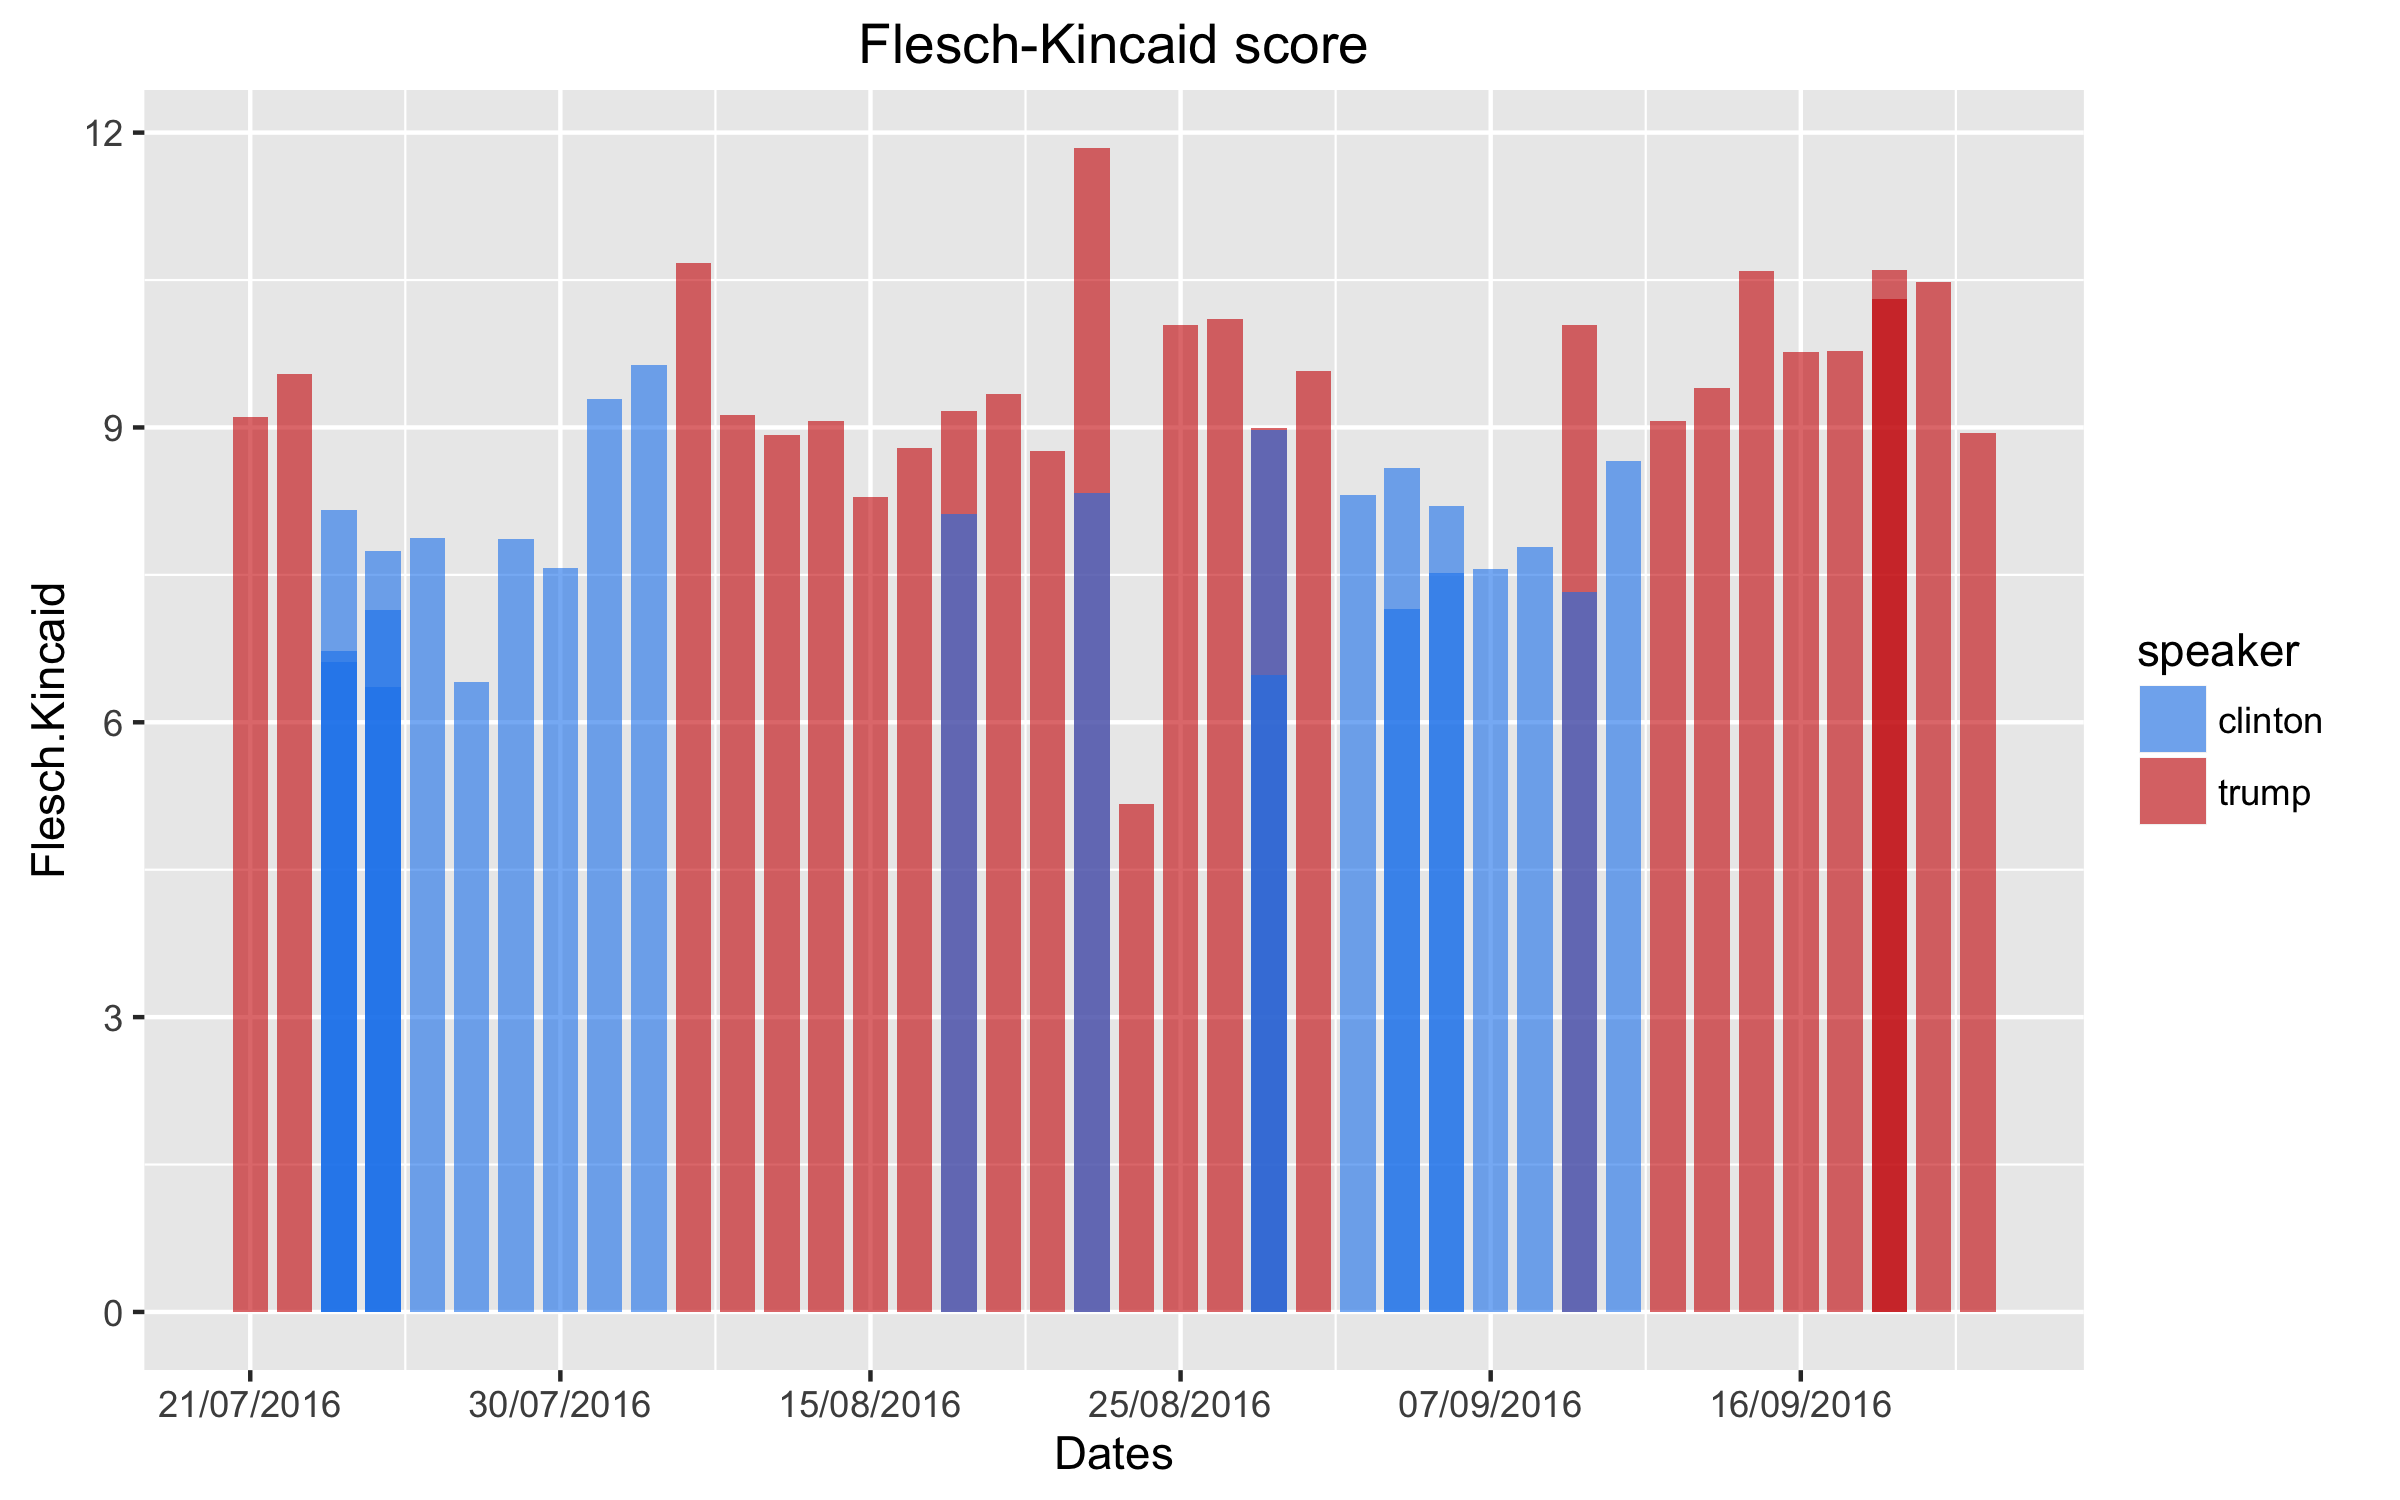
The Flesch-Kincaid score and the Dale-Chall index are roughly equivalent to American school grade levels. Interestingly, we see that Trump uses slightly more complicated language; but, this result is bound to be driven by the fact that—in contrast to Clinton’s speech transcripts—the transcripts provided by the Trump campaign are not as-delivered, but rather as-prepared. In fact, the outlier for Trump (a 5.2 in figure 3) is the one transcript that is a record of what he actually said rather than a copy of the prepared speech.
(Note that this results hold regardless what measure I use. See p. 57 of the Quanteda manual for an overview of all measures available.)
This teaches us two things about the current campaign (neither of which is too surprising): i) both candidates try to cater to the electorate by using easy language; and ii) Trump should listen to his speech writers and try to stay on-script.
And, of course the good news for Trump is that he does not talk like a third-grader; rather, he has the vocabulary of a fifth-grader.
We don’t know what is going to happen on November 8. But we do know that this election cycle has generated a host of speech data that analysists can delve into for years to come. I’ve only shown how text analysis can help us see patterns that we might reasonably suspect are out there. Who knows what future research might reveal.
Comments


1 Comment